Lancaster, PA local economy
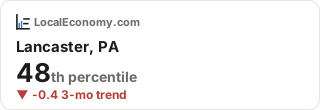
48th
Lancaster, PA ranks in the 48th percentile of United States metros as of September 2026, with momentum rising over the past 12 months.
Business formation
New business applications or registrations was 5,808 in January 2025, up 13.4% from January 2024.
Building permits
Dwelling units authorized by permit was 144 in July 2026.
Employment
Payrolled or covered employment was 252,516 in January 2026.
New business applications or registrations was 5,808 in January 2025, up 13.4% from January 2024. Dwelling units authorized by permit was 144 in July 2026.
Frequently asked questions
- How does Lancaster, PA rank among United States metros?
- Lancaster, PA ranks in the 48th percentile of United States metros as of September 2026, with momentum rising over the past 12 months.
- What is the new business applications or registrations in Lancaster, PA?
- New business applications or registrations in Lancaster, PA was 5,808 in January 2025.
- What is the dwelling units authorized by permit in Lancaster, PA?
- Dwelling units authorized by permit in Lancaster, PA was 144 in July 2026.
- What is the payrolled or covered employment in Lancaster, PA?
- Payrolled or covered employment in Lancaster, PA was 252,516 in January 2026.
Nearby and related
Sources and methodology
- U.S. Census Bureau — Business Formation Statistics (BFS)
- U.S. Census Bureau — Building Permits Survey (BPS), CBSA monthly
- U.S. Bureau of Labor Statistics — Quarterly Census of Employment and Wages (QCEW), national all-industry
Method: 2026.09. Updated 2026-09-10. Coverage: 100% of weighted components available.
Embed this badge
Free to use on your own site, a newsletter, or a council report. Links back to this page.
<a href="https://localeconomy.com/us/metro/lancaster-pa/" target="_blank" rel="noopener"><img src="https://localeconomy.com/badges/us/lancaster-pa.svg" width="320" height="110" alt="Lancaster, PA local economy score, via LocalEconomy.com" /></a>Cite this page
Lancaster, PA local economy indicators. LocalEconomy.com. Retrieved 2026-10-09 from https://localeconomy.com/us/metro/lancaster-pa/